Everybody wants to make more sales, but not everyone knows how to determine what is going wrong. You may find it hard to visualize how your business is faring – are you making more sales, more profit, reaching new areas…or is everything in decline?
By finding out where you are and projecting what will happen in the future, you’ll be able to make educated decisions on how to make changes for the better. This is where sales analysis comes into the picture.
What sales reports show and how to analyze them
At the most basic level, a sales report shows you how much sales (in numbers of sales or income from those sales) were made over a period of time. If it were to show sales of $1 in January, $2 in February, and $4 in March, you could project sales of $8 in April as the figures have doubled each month. You can assume there is little that needs to change, and things seem to be going well.
This information can be split in various different ways to give you more and more detail on how these sales are happening.
Imagine that the whole of your sales information is an onion, and you are the scientist who is about to investigate the onion. You can see it growing in the ground, and by measuring the size of it every week, you can predict how the onion will grow in the coming weeks – that’s your sales forecast.

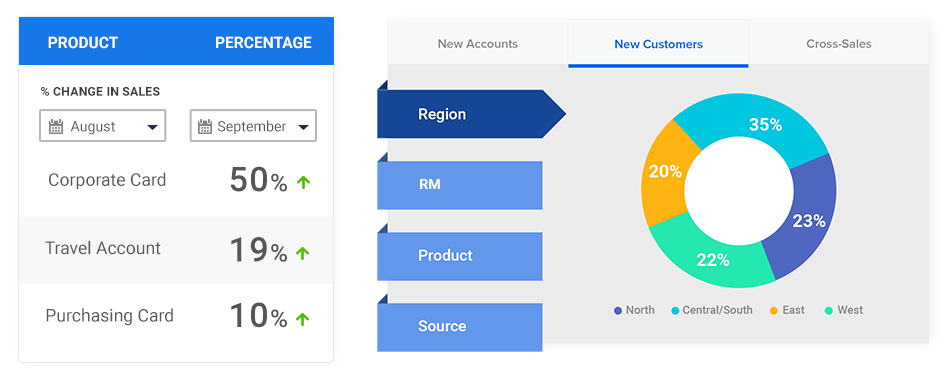
If you pull the onion out of the ground, you can slice it in half and you’ll see there are many layers inside. These layers could represent geographic locations where your sales team operates. If you could non-destructively measure these layers, you could predict how each layer (location) would grow over time, and see which layers might need a little more nutrition.
But you’re a scientist, so you’re always on a quest for more information. You take out one of these onion layers and place it under a microscope. Lo and behold, there are cells visible inside the onion now!
The cells could represent individual members of your sales team. If you measured them and saw how each cell grew compared to the other cells, you’d most likely find that some grew faster than others. You’d know which cells needed a little bit more attention to grow properly.
Of course, when it comes to onions, there’s only so much you can do to enhance their growth, but with employees within your company, you can respond to their needs accordingly.
Your onion might be growing faster on one side, rather than the other. This could be due to that side of the onion receiving more sunshine than the other side. Maybe particular locations convert more easily in your business, giving you this unbalanced onion shape.
Knowing this information – that sales are growing faster in one area than another – allows you to more accurately predict the future sales levels. When the sales have gone $1, $2, and $4, the next month may be $7 instead of $8 – the increase wasn’t due to doubling overall, but the sales in one area first increased by $1 (from $1 to $2 total) and then by $2 (from $2 to $4) and will now increase by $3 – 1, 2, 3 is the logical progression.
Who works hard and who works well?
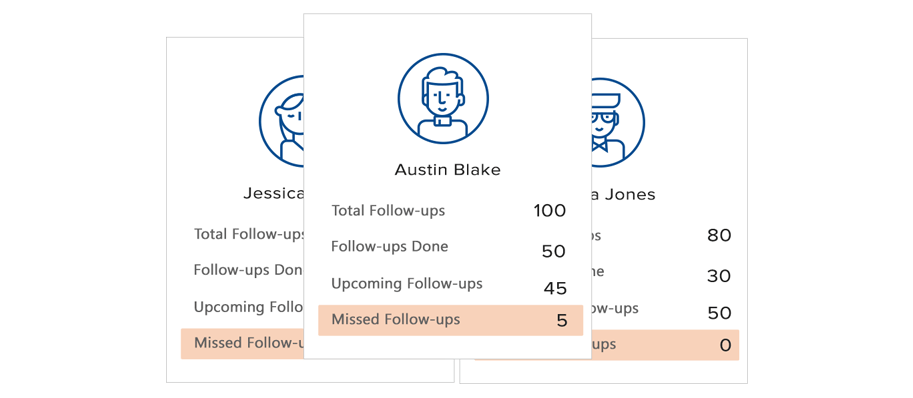
Your sales report can also include the amount of time that each salesperson worked – the time they checked in and the time they checked out can also be recorded. Some salespeople may work many hours to make a few sales, while others work a very short time and achieve double the sales figures.
 Do you let the long-workers go, and find replacements? You might just replace them with more long-workers. What you need to do is see the type of customer the high-achievers are working with, if there is a connection by location, if they are all selling the same product, and so on. By guiding the long-workers towards the practices of the high-achievers, you’ll build a stronger sales force.
But you’ll only be able to do this if you have access to the data in the first instance.
Tracking Leads
The success of your sales team depends partially on the availability of leads to work with. Information relating to how many people are in each stage of your sales process will identify the areas in which you need to make the improvement.
![]()
If your leads are perennially stuck in the first stage of your sales process, then something needs to be done to kickstart the entire sales system – the offer or appeal clearly isn’t strong enough to draw the crowd in.
Alternatively, if every lead is stuck at the penultimate step and not buying, your sales team will need to improve their closing skills.
When Analysis Cannot Occur
There is only one occasion when sales analysis cannot occur – when there is no data to look at. The reasons that cause you to have no data can vary.
Perhaps you are a startup, with no track record – that’s fine. Get working, results will come.
Perhaps you haven’t made any sales – that’s OK, but not great. Put some more work in, data is coming.
Perhaps you don’t bother to record this information – that’s really not OK. You cannot expect to build and grow a successful business without knowing where your business is right now.

Not tracking this information is like driving into the desert without a GPS and hoping to find a single tent. You don’t know where you’re going, even if you did you don’t know how to get there, and when you look behind you, you don’t know where you’ve been as all you see is sand. Everywhere.
By recording your sales data with LeadSquared you open up a whole world of reports and analysis. Not only is the information saved and presented to you as you want it, but it can also be segmented and rearranged exactly as you need it.
It’s like having a GPS, a book of maps, and a multitude of signposts to guide the way. Wouldn’t you feel better if you knew where your business was headed?
So how do you start analyzing your sales results? By having a good sales analytics tool that helps you to know what is happening at every single stage of your sales funnel. It should also give you detailed insights into the performance of your marketing campaigns and your sales team in terms of efficiency and revenue.
And that’s why LeadSquared is your best bet. Don’t believe me? Take a quick 15-day trial to check it out yourself.


