


Businesses everywhere are investing more in strengthening their customer service teams because they know that in today’s market, even a small slip-up in customer service could make customers go to another company instead. Businesses use SLA, or Service Level agreement, metrics to measure the quality of their service objectively.
A Service Level Agreement refers to an agreement between a business and its customer that defines how it functions in the future. In this regard, SLA metrics play a crucial role. They allow organizations to track, analyze, and optimize their customer service performance effectively. This helps businesses pinpoint areas that need improvement and take proactive steps to enhance their service quality.
Here are the ten key SLA metrics you must track to evaluate and improve the quality of your customer service:
Among the most important metrics to monitor, the NPS provides you with an overview of the level of client loyalty in your company. It gathers responses on a scale from 1 to 10 for a single question that inquires about a customer’s likelihood of recommending your business to a friend or colleague, for example. In this case, 0 means that someone is “unlikely” to recommend your business, but 10 means that they are “highly likely” to do so.
People who rank a firm between 0 and 6 are called detractors, whereas people who rate it between 7 and 10 are called promoters.
This is how you figure out your NPS:

Remember that the likelihood of your NPS being negative increases with the number of your critics. This makes it a useful metric for assessing how well your customer service is doing.
Just like the NPS is a score between 0 and 10, the Customer Effort Score scores your business on the amount of effort a customer has had to put in to have their issue resolved. The score derived from a scale of 1 to 10 is then converted to a percentage.
To put it simply, the CES is an indicator of the ease of issue resolution, as opposed to a customer’s overall satisfaction with your business (which we will discuss next).
The best way to track the CES for every customer is to request feedback across every customer service channel, be it a chatbot, phone call, or even email. A question along the lines of “How easy was it to have your issue resolved?” can be a great way to gather feedback.
In fact, a great way to incentivize customers to offer this feedback is to offer them a discount on a future purchase or subscription of your product or service.
The CSAT measures customer satisfaction with your service. Like the CES, it’s generally expressed as a percentage and is taken from customers’ responses to questions about satisfaction. One approach is to ask them whether they’re satisfied or not satisfied and divide the number of responses of both to get the overall percentage.
Alternatively, you can collect their responses on a scale of 1 to 5 or 1 to 10. You can also consider using a weighted average, which prioritizes customers who have had more recent interactions with your brand. This is the best way to express your customers’ satisfaction levels in the present moment.
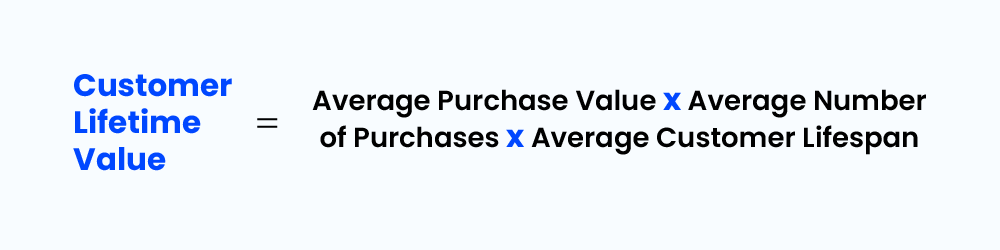
The total revenue a customer brings in for a company while their account is active is referred to as the CLV.
It’s important to keep in mind that customer retention closely correlates with income generation; the longer a consumer is a customer, the more revenue they bring in for your company.
Understanding how well your company maintains consumers and identifying gaps or areas for improvement can be greatly aided by the CLV. You can invest more resources in keeping clients and providing them with value if your CLV is lower.
This is how to figure out your CLV:
The ticket volume refers to the number of customer service tickets that your business receives within a given period.
This metric is crucial to helping identify trends that may be driving customers to see your business’s support. So, for example, if your business witnesses a sudden spike in ticket volume, this could indicate difficulties in the buying process or customer experience.
You can measure the total volume of tickets your business receives per day, month, or even year. However, a more granular approach (day or month) can help you identify trends or challenges with more precision.
The percentage of customers that cease doing business or producing income over a specific time period is known as the customer churn rate. This indicator, which is usually measured monthly or annually, can be used to forecast future corporate performance.
You can use this indicator to determine whether or not your customers are satisfied with their interactions with your brand. Customers who leave could indicate challenges with purchases or certain aspects of the customer experience.
What’s more, the churn can either be voluntary (when customers leave of their own accord) or involuntary (where they’re forced to leave due to a change in your business’s operations).
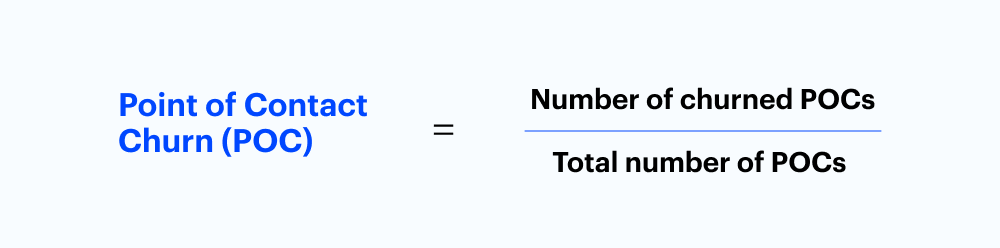
While the customer turnover rate is a crucial indicator of your business’s customer service, it may not always be the cause for concern. Sometimes, it could even be your point of contact; that’s the issue. If your business doesn’t attend to customers at their point of contact to train them on what your business has to offer, they might leave for a competitor who does.
This can be a helpful indicator for you to re-evaluate how to attend to customers at their point of contact to ensure reduced churn in the future.
Here’s how you can calculate your POC:
The average response time refers to the amount of time your customer service partner takes to attend to or respond to customer inquiries. This is typically measured in minutes or hours. The shorter the average response time, the less churn your business encounters, as customers believe you value their business and intend to eradicate any challenges they might be facing.
In fact, 39% of social media users expect businesses to respond within an hour, while statistics show that businesses respond to 63% of social media complaints within a period of 24 hours.
Faster response times are crucial to customer retention and can help generate consistent revenue for your business.
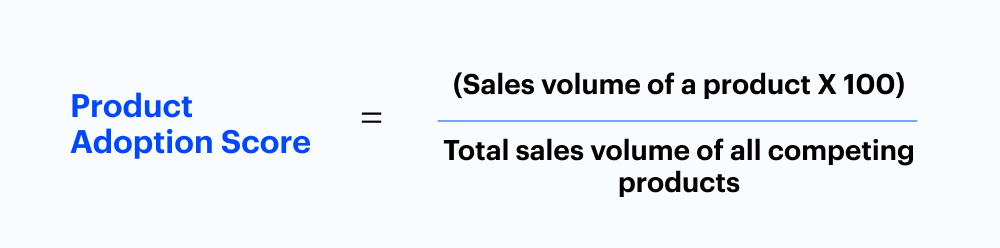
Your business’s production adoption score refers to the number of people who adopt or begin using your product or solution at a given point in time. It measures how many people switch to your product over those that don’t. As a result, this can be a brilliant indicator that can help you analyse the health of your marketing campaigns and customer service alike.
It can also help you analyze factors such as your product’s features and compatibility with your customers’ existing workflow.
Here’s how you can calculate your product adoption score:
Onboarding a new customer is a crucial stage that must be done right. Organizations that fail to onboard their customers the right way have customer service teams working to resolve issues for weeks or months on end. This takes away crucial time that customer service executives can otherwise spend improving their customer experience.
The key to ensuring your customers adopt your product is to educate them about its benefits right from the very outset, motivating them to make a purchase.
Tracking the metrics mentioned above can seem challenging, but with an end-to-end ticket management solution like LeadSquared’s Service CRM, you can benefit from granular control over every aspect of the customer’s journey and experience.

With its seamless and easy-to-navigate dashboard, you can track every metric mentioned above with ease. For instance, its unified channel listing gives you an overview of customer communication across every medium or channel, allowing you to track the average response time to each query, among others.
Similarly, you can also track the overall ticket volume, get an overview of the customer’s profile, manage child tickets and team analytics, and manage escalations, all in one comprehensive dashboard.
Studies show that seven out of every ten customers sever ties with businesses due to subpar service, while 93% of customer service teams attest to soaring customer expectations.
Providing a seamless customer experience and efficiently resolving customers’ issues is key to businesses’ long-term customer retention.
Whether your organisation has an in-house customer service team or has outsourced its requirements to a third party, several SLA metrics must be considered to ensure continuous improvement of the customer experience.
If you’re looking for a CRM that offers end-to-end ticket management solutions and a seamless experience, check out LeadSquared. It offers a host of features that make managing customer service easy.
Book a demo to learn more!
SLA metrics give companies the ability to efficiently track and improve the quality of their customer service. Tracking important metrics like customer satisfaction scores, resolution rates, and response times helps organisations pinpoint areas for improvement and take proactive measures to raise the calibre of their services.
Companies can customize their services by using SLA metrics to learn more about their customers’ preferences and behaviors.
By analyzing measures such as Net Promoter Score (NPS) and Customer Effort Score (CES), organizations can identify pain areas in the customer journey and execute strategies to address them, ultimately leading to increased satisfaction levels.
One common challenge is ensuring data accuracy and consistency across different channels and touchpoints.
Also, interpreting SLA metrics in isolation without considering broader business objectives can lead to ineffective decision-making. Businesses should also regularly review and update their SLA metrics to reflect evolving customer needs and market dynamics.


 Fail-Safe Strategies for Automated Ticket Resolution