In sales, success isn’t just about charm and persuasion – it’s also about data-driven decisions and continuous improvement. That’s where sales performance metrics come in. These metrics give you valuable insights into your team’s performance so you can find areas to grow and improve your sales process.
In this guide, we will cover 15 sales performance metrics that will transform your team’s performance and boost your revenue. Whether you are a seasoned sales manager or an entrepreneur, you will find practical tips and actionable strategies to implement these metrics and grow your business.
But before we get started, let’s answer a big question:
The Importance of Tracking Sales Performance Metrics
Sales performance metrics are the compass that guides your sales team to success. They give you:
- Instead of relying on gut feeling, metrics give you data to measure performance objectively.
- Metrics help align individual and team goals with overall business goals.
- It shows you where to train and improve processes.
- Historical data from metrics gives you more accurate sales forecasting.
- Measurable goals boost team morale and competition.
Companies that use analytics to measure sales performance see better growth in team quota achievement than those that don’t.
Now, let’s get to the 15 sales performance metrics.
1. Conversion Rate
Conversion rate indicates the percentage of leads that convert to customers.
How to calculate:
Conversion Rate = (Number of Sales / Number of Leads) x 100
Why it matters:
Conversion rate is a basic metric that reflects your team’s ability to close deals. A high conversion rate means you have a good sales process and product-market fit.
How to improve your sales conversion rate:
- Analyze your sales funnel to find bottlenecks
- Implement lead scoring to focus on high-quality leads
- Provide sales training to improve closing skills
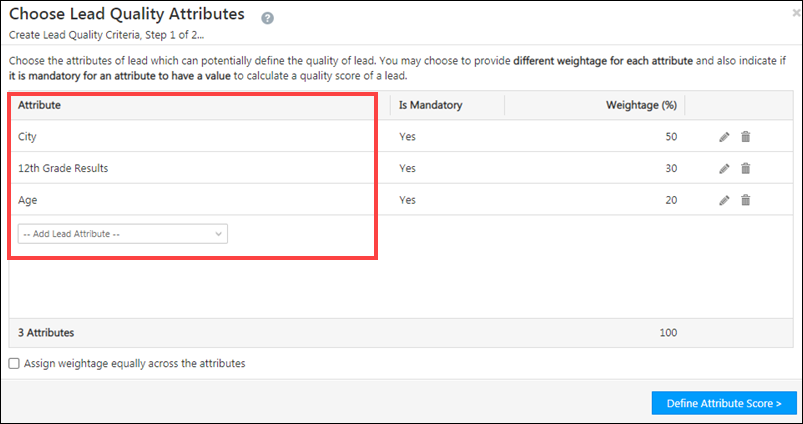
You can use LeadSquared’s built-in lead scoring feature to auto-qualify and prioritize leads so your team can focus on the best opportunities.
2. Average Deal Size
It indicates the average value of closed deals.
How to calculate:
Average Deal Size = Total Revenue / Number of Closed Deals
Why it matters:
This metric gives you an idea of the value of your sales and can help with pricing and sales targets.
How to improve your average deal size:
- Use value-based selling techniques
- Offer product bundles or upsells
- Train your team on negotiation skills
LeadSquared’s opportunity management feature helps you track and analyze deal duration so you can find trends and opportunities to shorten the sales cycle.
3. Sales Cycle Length
Sales cycle length shows the average time to close a deal from first contact.
How to calculate:
Sales Cycle Length = Total Number of Days to Close All Deals / Number of Closed Deals
Why it matters:
A shorter sales cycle means a more efficient process and higher revenue velocity.
How to reduce the sales cycle:
- Simplify your sales process
- Provide timely and relevant content to prospects
- Use automation to speed up administrative tasks
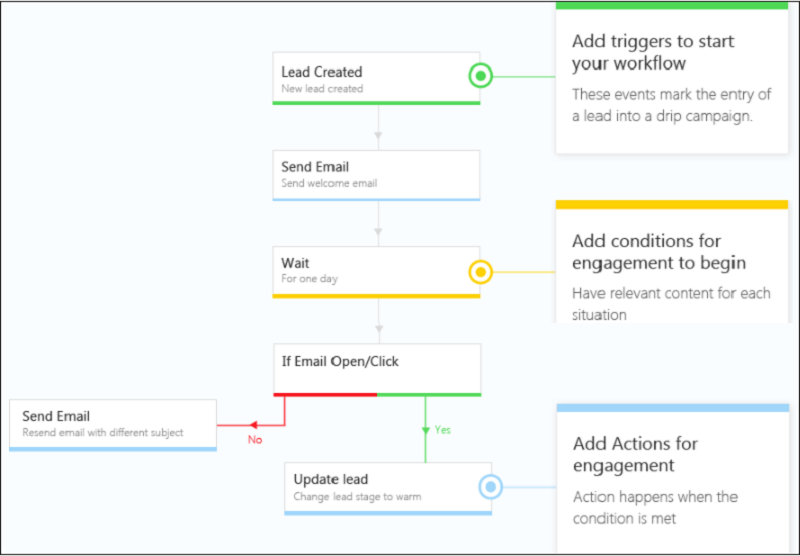
Use LeadSquared’s workflow automation to simplify your sales process, reduce manual tasks, and shorten the sales cycle.
4. Win Rate
The win rate is the percentage of opportunities that close.
How to calculate:
Win Rate = (Number of Won Opportunities / Total Opportunities) x 100
Why it matters:
Win rate is a measure of your team’s overall ability to convert opportunities into sales.
How to improve your win rate:
- Refine your qualification process to focus on high-quality opportunities
- Develop and implement a sales methodology
- Review lost deals to find areas of improvement
You can use LeadSquared’s pipeline management feature to track opportunities at each stage so you can see where deals are won or lost.
5. Customer Acquisition Cost (CAC)
CAC calculates the total cost or the money spent in acquiring a new customer.
How to calculate:
CAC = Total Sales and Marketing Expenses / Number of New Customers Acquired
Why it matters:
CAC helps you understand the effectiveness of your sales and marketing efforts and make sure you’re not spending more to acquire customers than they’re worth.
How to reduce your CAC:
- Optimize your marketing channels
- Improve lead nurturing processes
- Increase customer retention to reduce the need for constant acquisition
Use LeadSquared’s reporting feature to track all sales and marketing expenses so you can calculate and monitor your CAC over time. You can also track CAC source or channel-wise and device measures to optimize channels where CAC is higher than the industry average.
6. Customer Lifetime Value (CLV)
CLV is the total revenue a business can expect from a single customer account over the lifetime of the business relationship.
How to calculate:
CLV = (Average Purchase Value x Average Purchase Frequency Rate) x Average Customer Lifespan
Why it matters:
CLV helps you understand the long-term value of your customers and can guide your customer acquisition and retention strategies.
How to improve your CLV:
- Implement customer loyalty programs
- Provide exceptional customer service
- Invest in upsell and cross-sell strategies
LeadSquared’s opportunity management feature signals you about upselling and cross-selling opportunities based on the customer’s interaction with your website and ads. It aids you in increasing your CLV.
7. Sales Productivity
Sales productivity is the measure of your team’s revenue generation efficiency.
How to calculate:
Sales Productivity = Total Revenue / Number of Sales Representatives
Why it matters:
This metric helps you see how well your team is using their time and resources to generate sales.
How to improve sales productivity:
- Use time-saving tools and technologies
- Provide ongoing training and coaching
- Simplify your sales process to remove bottlenecks
LeadSquared’s sales automation features can help your team be more productive by automating repetitive tasks and providing instant access to information.
8. Lead Response Time
Lead response time indicates the time your team takes to respond to a new lead.
How to calculate:
Lead Response Time = Total Response Time for All Leads / Number of Leads
Why it matters:
A faster response can increase your chances of conversion. In fact, a Harvard Business Review study found that companies that contacted potential customers within an hour of receiving an inquiry were 7 times more likely to qualify the lead than those who waited even an hour more.
How to improve your lead response time:
- Automate lead routing
- Set up instant notifications for new leads
- Set response time goals for your team
9. Pipeline Velocity
Pipeline velocity is the speed at which leads move through your sales pipeline.
How to calculate:
Pipeline Velocity = (Number of Opportunities x Average Deal Size x Win Rate) / Average Sales Cycle Length
Why it matters:
Pipeline velocity gives you an overall view of your sales process efficiency and revenue potential.
How to improve pipeline velocity:
- Optimize each stage of your sales pipeline
- Focus on high-quality leads
- Provide targeted content and support at each pipeline stage
LeadSquared allows you to manage your sales pipeline effectively, giving visibility into all stages, including people working on the leads. It helps sales reps prioritize promising leads and close deals faster.
10. Sales Forecast Accuracy
This sales performance metric gives you an insight into how accurate your sales predictions are compared to actuals.
How to calculate:
Sales Forecast Accuracy = (Actual Sales – Forecasted Sales) / Forecasted Sales x 100
Why it matters:
Accurate forecasting is key to business planning and resource allocation. Companies with accurate sales forecasts are more likely to grow their annual revenue year-over-year.
How to improve your forecasting accuracy:
- Use historical data to predict
- Update and refine your forecasting model regularly
- Consider external factors that impact sales
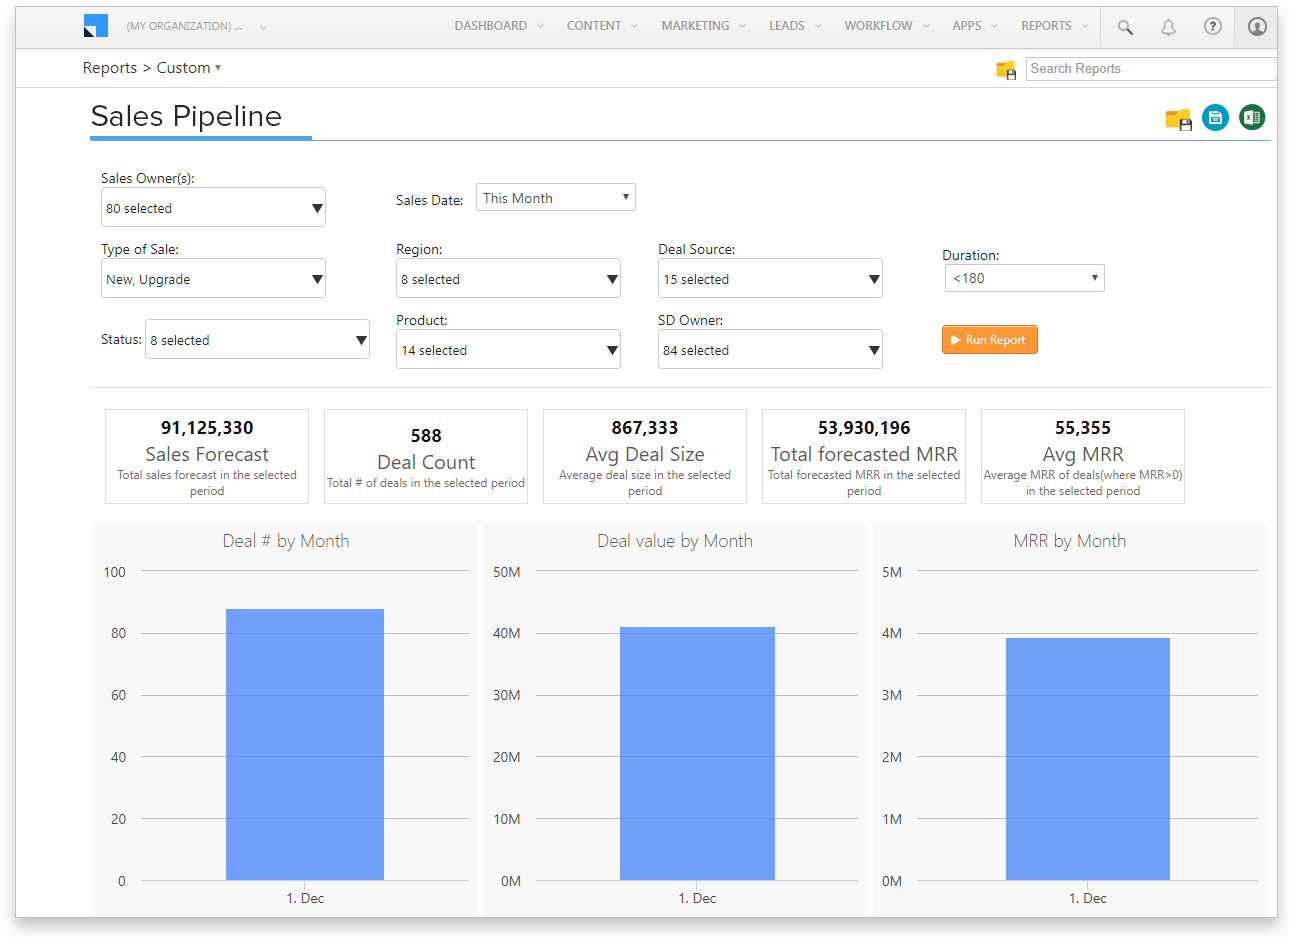
LeadSquared’s reporting and analytics features can help you create more accurate sales forecasts based on historical data and the current pipeline.
11. Net Promoter Score (NPS)
NPS is the measure of customer satisfaction and loyalty.
How to calculate:
NPS = Percentage of Promoters – Percentage of Detractors
Why it matters:
NPS is a good indicator of customer satisfaction and can predict future growth. According to Bain & Company, companies with the highest NPS in their industry grow at least 2x faster than their competitors.
How to improve your NPS:
- Deliver high-quality products or services consistently
- Provide great customer service
- Act on customer feedback to improve your offerings
12. Sales by Region or Territory
It is a breakdown of sales performance by geography.
How to calculate:
Sales by Region = Total Sales Revenue / Number of Regions or Territories
Why it matters:
This metric helps you know which regions are performing well and where you need to focus more.
How to improve your region-wise sales:
- Analyze successful regions to replicate best practices
- Provide additional support or training to underperforming regions
- Consider adjusting your strategy based on regional differences
LeadSquared allows you to create custom reports that break down sales by Region or territory to identify top-performing regions and areas for improvement.
13. Sales Activity Metrics
This sales performance metric measures various activities your sales team does, such as calls made, emails sent, or meetings scheduled.
How to calculate:
Sales Activity Metrics = Total Number of Specific Activities / Time Period
Why it matters:
Activity metrics give you insight into your team’s work ethic and can help you find correlations between specific activities and sales success.
How to improve it:
- Set activity goals for your team
- Use automation to track activities accurately
- Analyze which activities yield the best results and focus on those
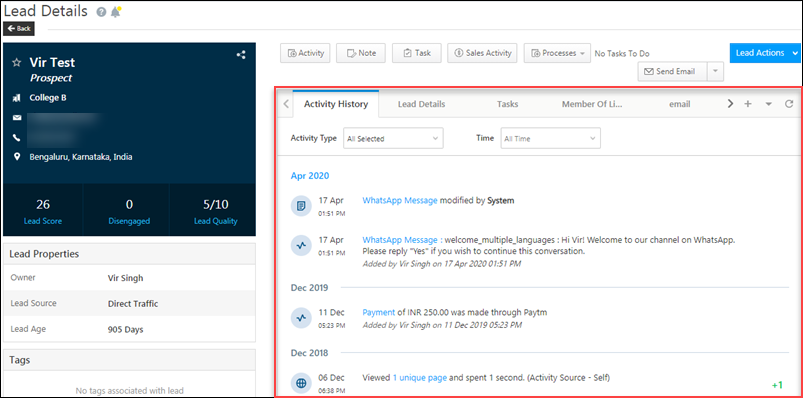
LeadSquared’s activity tracking feature allows you to monitor and analyze all sales activities to know what works.
14. Average Profit Margin
This sales performance metric describes the profit percentage on each sale after all costs.
How to calculate:
Average Profit Margin = (Total Revenue – Total Costs) / Total Revenue x 100
Why it matters:
Profit margin helps you know the true profitability of your sales beyond just revenue numbers.
How to increase your average profit margin:
- Optimize your pricing strategy
- Reduce costs without compromising quality
- Focus on high-margin products or services
15. Quota Attainment
The quota attainment rate is the percentage of salespeople who meet or exceed their quota.
How to calculate:
Quota Attainment = (Number of Reps Who Met Quota / Total Number of Reps) x 100
Why it matters:
This metric helps you know how your sales team is performing and your quota-setting process.
How to improve your team’s quota attainment rate:
- Make quotas challenging but achievable
- Provide ongoing coaching and support
- Recognize and reward high performers
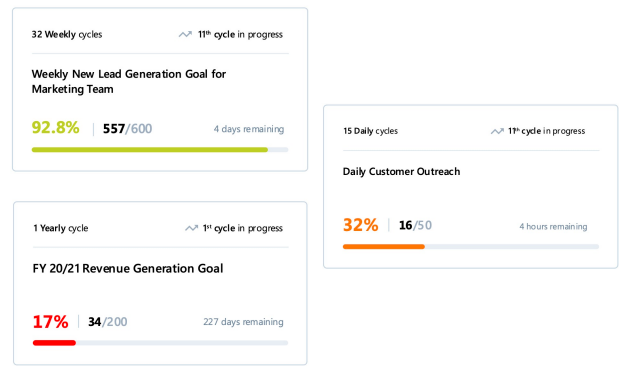
You can use LeadSquared’s performance tracking feature to monitor quota attainment in real-time so you can intervene and support on time.
Conclusion
Measuring these sales performance metrics can improve your sales process, boost your team’s performance, and grow revenue big time.
However, it’s not just about tracking these metrics but using the insights to continuously improve your sales strategy and process.
Tracking and managing these metrics can be overwhelming, but with the right tool, it’s much simpler. LeadSquared’s CRM has all the features you need to track, analyze, and act on these metrics. From lead scoring and pipeline management to advanced reporting and mobile access, LeadSquared enables your team to perform better.
Ready to level up your sales performance? Book a demo of LeadSquared today and see how our CRM can help you achieve sales success like never before.


