Gone are the days when we had to get software programs on disks and make purchases every time a new version came out.
We’re in the era of SaaS—Software as a Service.
By 2023, the SaaS market is estimated to reach 152 billion U.S. dollars.
A service-based model allows companies to make changes faster, integrate new product features, or fix bugs on the fly.
However, SaaS models can also get quite complex while trying to figure out your company’s growth. The SaaS landscape has become extremely competitive and will stay that way. Companies need to regularly monitor their performance to stay ahead of the competition.
The question is—what metrics SaaS companies should chase to ensure they’re on the top of their game.
We provide solutions to over 2000 businesses worldwide (including SaaS companies), and we have the answer.
Read on to find out the most important SaaS metrics you should go after to achieve sustainable growth.
Contents:
>> SaaS customer acquisition metrics
Website traffic
CAC
Months to recover CAC
CAC to LTV ratio
Lead velocity rate
Viral coefficient
Product qualified leads>> SaaS sales metrics
MRR and CMRR
ARPA
Customer conversion rate
CLV
Customer and revenue churn>> SaaS customer experience and satisfaction metrics
NPS
Number of support tickets created
Average first response time
Average resolution time
Number of active users
Stickiness ratio
SaaS customer acquisition metrics
These metrics give you insights into the channels that bring leads and conversions, the cost of customer acquisition, and more. The goal is to reduce acquisition costs by analyzing these SaaS metrics.
1. Website traffic
Website traffic is simply the number of visitors to your website per day.
It goes without saying, Google Analytics (GA) is the most popular tool for measuring website traffic. Other tools you can use are:
- SEO tools like SEMRush, Ahrefs, etc.
- Bing Analytics to measure your website traffic through the Bing search engine
While calculating this metric,
- Exclude internal visitors (you can do it by blocking IP addresses in your Google Analytics)
- Track the sources of website traffic
- Keep in account new vs. repeat users. New (unique) users give you an idea about your increasing brand awareness. In contrast, repeat users tell you that people trust your content and keep coming back for more information.
- Track pages that drive maximum traffic. Utilize these pages to link your new resources and transfer page authority to those pages.
- Track pages that drive maximum conversions/sign-ups. You can track this by setting goals and a conversion funnel in your GA.
What does website traffic as a SaaS metric tell you?
A typical sales funnel for SaaS companies looks like this:
Website visit >> Sign-up for free-trial/Demo >> Subscribes to your product/service >> Continues renewing their subscription (retention)
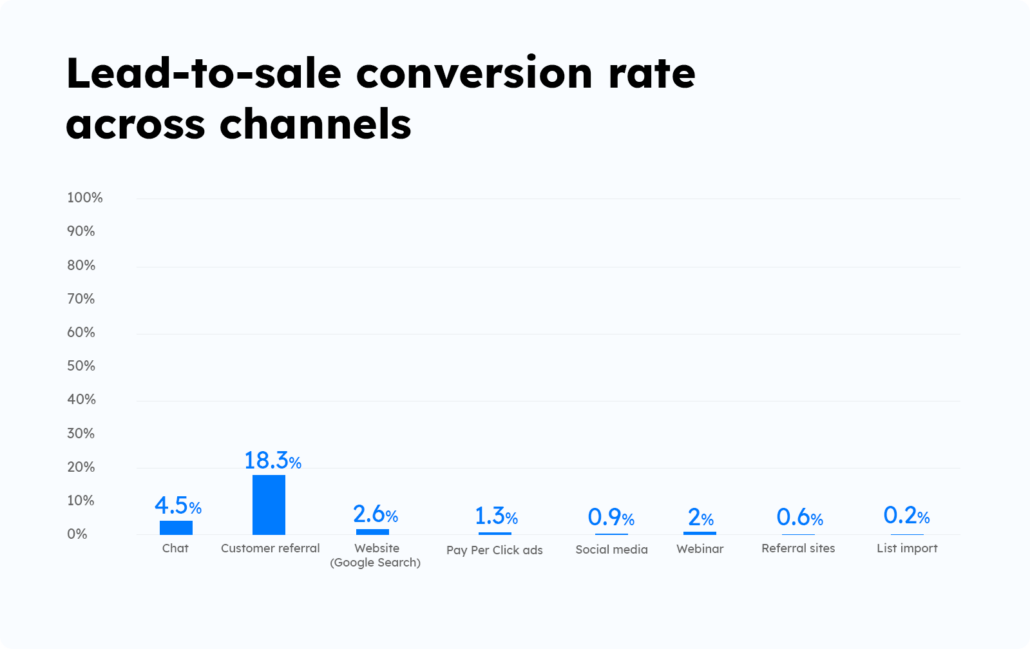
You may have several sources of website traffic, and the conversion rates vary for each of these sources.
Tracking the traffic, traffic sources, and conversion rates across channels gives you an insight into the sources you should invest in the most.
For instance, we have seen inbound leads through live chat (4%), Google Search (2.6%), webinars (2%), and PPC (1.3%) have higher conversion rates than referral sites (0.6%) and social media (0.9%).
Measures you can take to improve website traffic
Well, the most common answer you’ll hear is to improve your SEO. While that’s true, SEO does help you gain inbound traffic in the long run, it’s best to analyze what can bring you the desired traffic to achieve your bottom line.
Take for instance, Salesforce. Their main source of traffic is the referral. That is, they drive a majority of their traffic from partner network.
On the other hand, Canva drives a majority of its traffic from search or SEO.
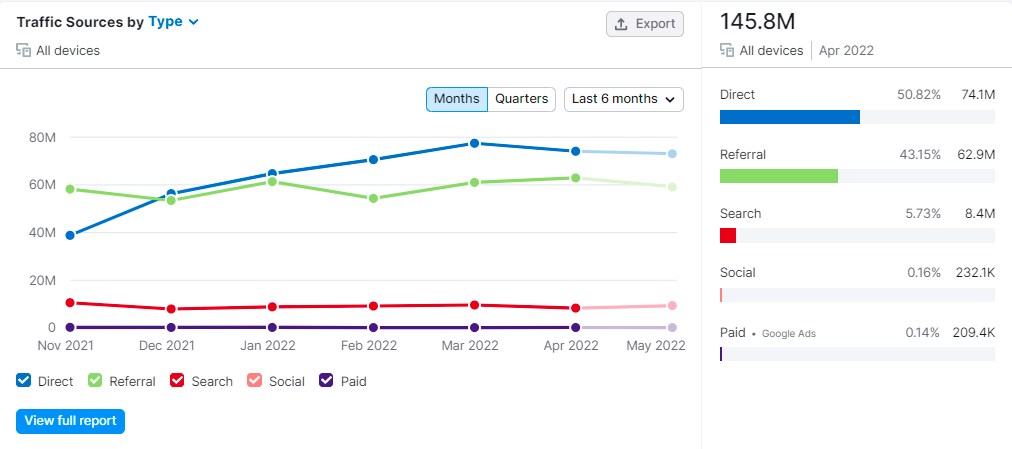
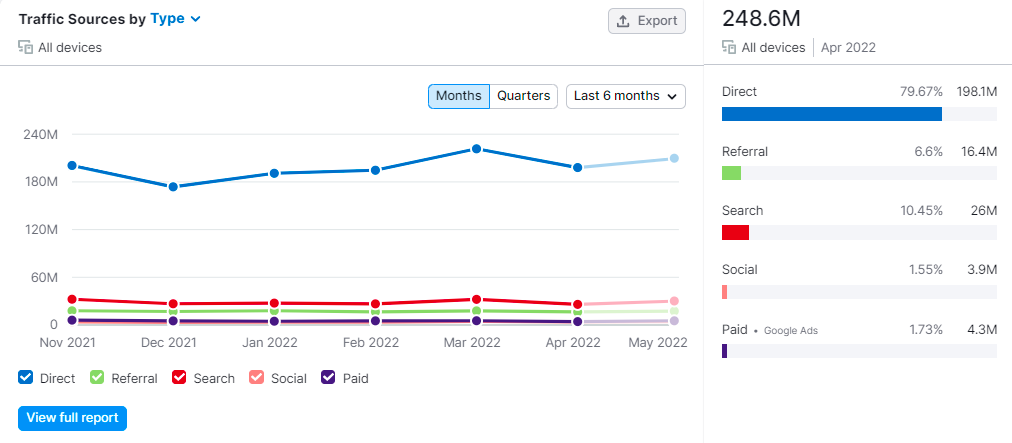
The point is that you need to create a lead journey and identify sources that bring you actual sales (not just sign-ups). In 5 quick steps:
- Identify sources that bring you sales
- Monitor website traffic driven by those sources
- Create a plan to drive incremental growth through those sources
- Use GTM (Google Tag Manager) to track traffic from those sources
- Create custom reports in GA to save time and efforts
2. Customer acquisition cost (CAC)
CAC is the amount of money a brand spends on acquiring a customer.
For new companies, CAC makes up a large part of their cost. Hence, it’s important to understand the sources of lead acquisition and how you can optimize it for better returns.
Formula:

For example, if you spend a total of $100k on getting 100 new customers, then your CAC would be $100000 / 100 = $1k.
What is a good CAC?
While you may find benchmarks for your industry, it’s equally important to compare CAC with your CLV (Customer Lifetime Value). Ideally, the CLV should be at least 3x of your CAC for sustainable growth.
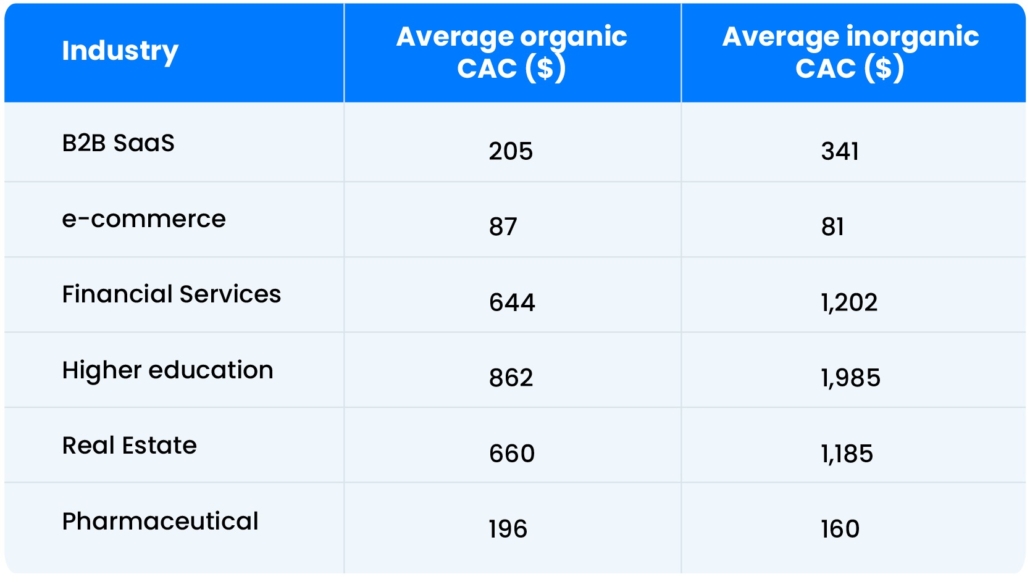
According to HockeyStack, SaaS companies usually have an average customer acquisition cost of $205.
The CAC depends on:
- Industries you operate in
- The customer segment you target (B2B or B2C)
- The channel of advertising (for example, display ads have lower CAC than search ads)
First Page Sage, a renowned marketing agency in San Francisco, California, published the average CAC by industry in the organic and inorganic* categories. You can use this to benchmark your spending basis your target industry.
*Organic – mostly SEO, and inorganic – PPC and SEM
How to reduce your customer acquisition cost
It’s crucial to keep your CAC in check to avoid burning millions of dollars.
For instance, in 2020, worldwide, fintech app marketers invested $3 billion in new customer acquisitions. But sadly, they saw an average 35.5% uninstall rate. Finance companies lose about $80,000 per month on uninstallers that did not generate any revenue using the app.
You can try the following strategies to reduce your CAC.
- Create your ideal customer profile and create targeted ads for them
- Retarget the audience that visits pricing and product/service pages
- Encourage customer referrals
- Upsell and cross-sell more
- Device strategies to reduce churn and increase customer retention
3. Months to recover CAC
Months to recover CAC is also known as the CAC Payback Period. It is the number of months needed to generate the revenue to cover the cost of customer acquisition.
It tells you how long the customer’s lifetime should be for you to profit. The smaller this value, the better. As companies grow, these values tend to get smaller.
Formula:

Let’s say that you spend $2k to get a new customer and they subscribe to a service that costs $400 a month. If you have a gross margin of 80% or 0.8, then you will take a little over 6 months to make the revenue you lost to acquire the customer.
What’s the ideal CAC payback period?
As a rule of thumb, companies must recover their CAC within a year. However, many successful SaaS companies are able to recover CAC in 5-7 months. A reduction in the payback period over time is one of the best indicators of growth.
How can you reduce the months to recover CAC metric?
One way to look at this is, if you’re able to reduce your CAC, the months to recover CAC will also reduce automatically.
Otherwise, you should take measures to improve customer monetization. Companies that aren’t able to monetize the game experience loss in profits. A possible solution is to revise your pricing plans.
4. LTV to CAC ratio
This SaaS metric shows how much you spend to get a customer and how long the customer stays. LTV stands for Lifetime value, which is the same as CLV or Customer Lifetime Value.
The LTV:CAC ratio is represented as a real number.
For example, if you spend $400 to get a new customer and the customer generates revenue of $5000, then the ratio is 25:2, which can be reduced to 12.5.
What does LTV to CAC ratio indicate?
LTV to CAC ratio shows if you are spending too much on getting new customers and not making that money.
A value of 1 means you are making the same amount as the amount you are spending on acquiring the customer.
Anything less than 1 means that you are losing money.
Oftentimes, a poor LTV to CAC ratio indicates you’re not able to monetize customers, and a high churn cause companies to fail.
Note that this SaaS metric varies according to the industry you operate in. However, SaaS companies should aim for LTV to CAC ratio of 3:1.
How to improve CAC to LTV ratio
The more time a customer spends on your app, the better it is for you. You can improve this metric by:
- Increasing customer engagement on your app
- Identify habits of your customers, the way they interact with your app and try to monetize on that
- Consider up-selling and cross-selling
- Take measures to increase customer retention
5. Lead velocity rate
Lead Velocity Rate (LVR) shows the rate of increase in the number of qualified leads.
Formula:

For example, if you got 100 qualified leads last month and 126 leads this month, then you have a 26% increase. So, the LVR is 26%.
What does lead velocity rate signifies?
LVR is a forward-looking metric that can help predict business growth over time. It shows how many more potential customers that company is engaging with. A positive value indicates that people are aware of your presence and interested in business with you.
“This metric is less relevant for SaaS startups with very low ARPA (Average Revenue Per Account) and very short sales cycles but extremely relevant for SaaS companies selling bigger deals. For SaaS startups with a low ARPA, I look at the development of free trials instead.”
Christoph Janz, Co-founder & Managing Partner, Point Nine Angel VC (via geckoboard)
How to improve lead velocity rate
“Does the company have 6x+ the amount of pipeline to their bookings plan (target revenue)? If so, you can be confident they will achieve the next period’s plan.”
Tom Tunguz, Partner at Redpoint Ventures (via geckoboard)
Note that increasing lead velocity is your attempt to increase the number of qualified leads. And not just any leads. Therefore, be cautious about the measures you take to improve this metric.
I’ll give you an example to explain this.
Let’s say you offer online learning programs for corporates. You run PPC campaigns and generate about 40-50 qualified leads per week.
Now, to increase leads, you cannot simply expand your audience targeting. Because otherwise, you’ll be pulling several non-qualified leads.
The idea is to try different strategies to attract more “qualified” leads. For example, you can explore referral marketing or start advertising on review sites if you haven’t tried it yet.
6. Viral coefficient
The viral Coefficient determines at what rate the brand is growing because of word-of-mouth marketing or because referrals.
You can calculate viral coefficient by using the following formula:

Suppose, on average, a user sends out 25 invites and 60% of those invites help you get paying customers. Then your vial coefficient is 25*0.6=15. This means that for every signup, you get 15 additional signups. However, in reality, this number is much lower.
How can SaaS companies improve their viral coefficient metric?
Before we get into this, let me tell you a story.
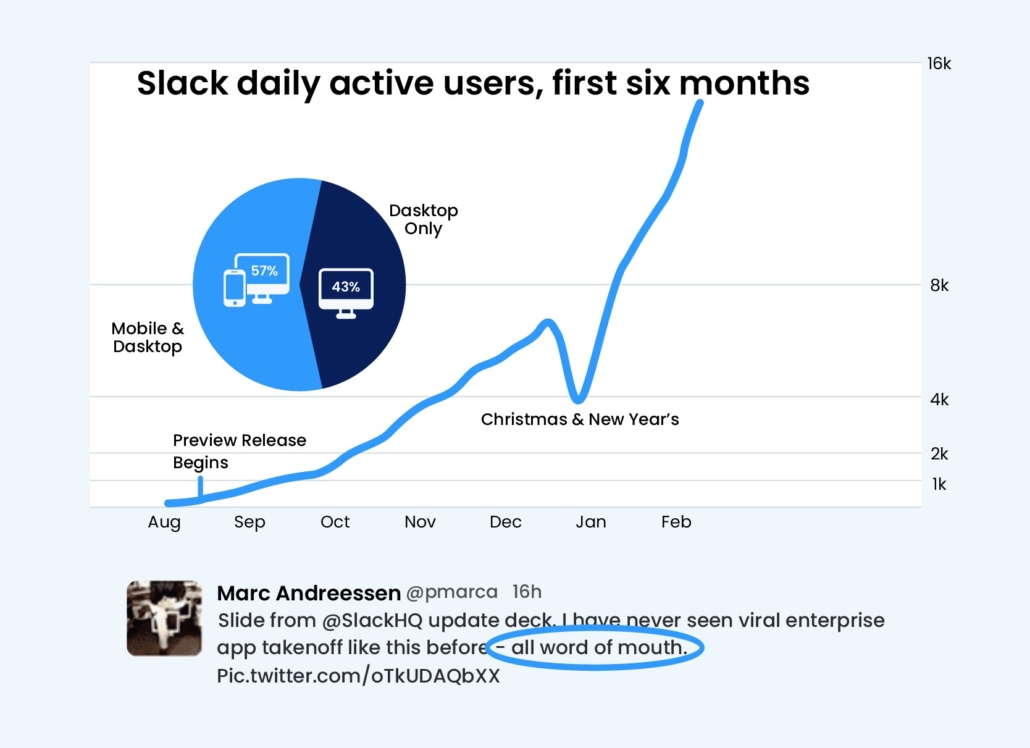
In August 2013, Slack invited people to try out their beta version (they called it a preview release, but we know it means the same!).
Initially, around 8k people signed up. In the next two weeks, their number of users grew to 15k. And by the time they launched publicly, they had some 285k daily active users.
How did they do it?
Well, through word-of-mouth marketing.
They built in a viral loop that asks users to invite their peers to collaborate on a project. Brainy, right!
Simple onboarding and seamless collaboration are incentives for people to use the app. It also became their USP for acquiring more customers.
You can also achieve viral growth by understanding why people love your product in the first place. Use this information to build a referral program to invite more customers. But remember to incentivize your customers and referrals generously!
7. Product qualified leads
MQLs and SQLs have been talked about a lot lately. But when it comes to SaaS, tracking the number of product-qualified leads you generate is important.
Product Qualified Leads are the leads who have tried your product or service in a way that strongly suggests they will become a paying customer.
For example, if you provide an online file sharing service, users in the free tier who use a lot of space and sign in every day could pay for more storage.
How to measure product qualified leads
To track Product Qualified Leads, you need to define triggers. These triggers signify that the customer is likely to become a paying user. You can find such triggers through the analysis of historical data. PQL count is an important metric as it shows which features you need to improve to get more paying customers.
How to increase PQLs
It all starts with knowing your customers very well. You can take customer feedback, surveys, etc., to understand which features they like the most.
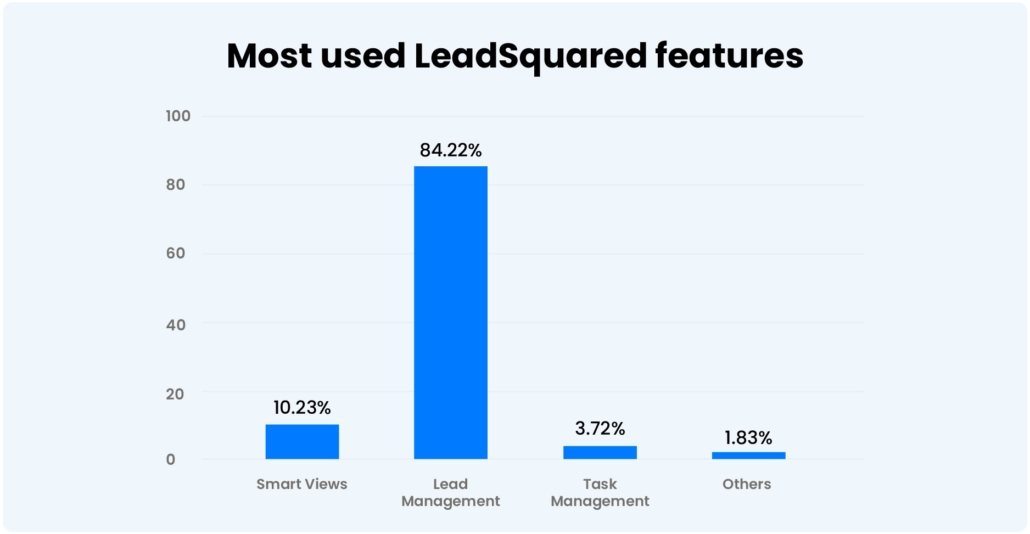
For example, we asked our sales users about their favorite feature in LeadSquared. 84% of them reported lead management. It gives us an idea to monetize this feature and improve it from time to time.
SaaS sales metrics
These SaaS metrics help you understand your sales and growth roadmap.
8. MRR and CMRR
MRR is the revenue you generate per month from paying customers for your service.
Formula:

For example, if you have three service tiers: free, basic, and premium charged at $0, $5, and $9 per month, and on a given month you have 10k free customers, 12k basic customers, and 2k premium customers, then your MRR for that month would be (5*12k) + (9*2k) = $78k.
Why is it important to track MRR?
MRR answers the question: How much are you making in a month? Depending on what service you are offering, the regions you operate in, and multiple other factors, MRR will vary each month. When you look at MRR across a couple of years, you can find repeating patterns. There will be certain months where your revenue grows, and on certain months, it will fall. Depending on the MRR trend, you can design marketing campaigns to make your business grow better.
Here’s a detailed guide on MRR with tips to improve this metric.
CMRR
You’ll find several variations in calculating MRR. One that’s important for SaaS, especially when you strategically upsell, is CMRR or Committed Monthly Recurring Revenue.
CMRR shows the future monthly recurring revenues if the company freezes all sales and marketing efforts.
Formula:

CMRR gives a clearer picture of the financial state of the company. It is crucial for forecasting future revenues.
9. Average revenue per account or ARPA
Average Revenue Per Account (ARPA) or average revenue per user (ARPU) is the amount of revenue generated per account on average each month. You can calculate ARPA quarterly or yearly, depending on your billing options. Some companies also call this the ASP or the average sales price.
Formula:

Taking the previous example, given your MRR is $78k and you have 14k paying customers, your average sales price is around $5.57. You get this data directly from your CRM or invoicing software.
Why is it important to calculate ARPA?
Calculating ARPA is crucial when you have multiple pricing tiers. This SaaS metric gives you an idea of the pricing tier that the majority of your customers are opting for.
10. Customer conversion rate
The conversion rate defines the fraction of interested leads who become paying customers of the brand.
Formula:

Suppose you get 20k form signups and 5k people engaging with you on social media. Among these 25k people, only 8k people become paying customers. Therefore, your conversion rate is 8k/25k = 0.32. It means that out of 100 people you engage with, 32 people are likely to become paying customers.
Why is it important to track conversion rates?
Conversion rate helps you understand the effectiveness of your sales and marketing efforts. The higher your conversion rates the more revenue you gain.
How to increase your conversion rates?
Increasing the conversion rate does not depend on one factor. You need to optimize every stage of your sales funnel. Let’s understand this with an example.
You’ve got a target of 4X your customers. Now break this up into steps that lead to conversions. In general, it will involve lead generation, qualification, demonstration or product trial, price negotiation, and finally conversion.
If you’re putting more effort into lead generation but not enough on other steps, you may not achieve the desired results. Similarly, if you’re not able to generate product-qualified leads, your efforts in the demonstration will not yield results. So, keep a tab on your sales KPIs to increase the overall conversion rate.
11. CLV
CLV is the average amount of money a customer pays during their engagement with your company.
Say you have an average customer lifetime of 18 months. You can get the customer lifetime from your churn rate value. Next, you need to calculate the average revenue per account or ARPA. Now, ARPA may have multiple components based on your business model. You can do it simply by taking the revenue for a month and dividing it by the number of customers. So, if your revenue for a month is $500k and you have 100 customers, then your ARPA value is $5k. Now, for 18 months, you get a CLV is 18 times $5k, which is $90k.
Why is it important to calculate CLV?
For businesses that are still operating as startups, the CLV is a great metric to show investors as it reveals the rate at which the company is bringing in revenue. Furthermore, CLV can also help understand the effectiveness of upselling and cross-selling efforts.
Here’s a detailed guide on CLV.
12. Customer and revenue churn
Customer churn is the number of customers a business loses in a given period.
Formula:

For example, if you had 100 customers at the beginning of a month and by the end of the month, you lose 5 of the original customers, then you have a churn rate of (5/100) *100 or 5%.
Churn is inevitable. For instance, in its early days, Netflix had a monthly churn rate of 10%. But you can take measures to reduce the churn rate.
Why should you keep an eye on your churn rate?
Getting new customers is expensive. So, you need to increase customer retention efforts to ensure that your original customers do not leave. The churn rate determines how well your customer retention efforts are working. The lower the value, the better.
Some businesses also want to keep a check on their revenue churn rate.
Revenue churn is the revenue lost when losing customers. Since not all customers are equally profitable, revenue churn directly indicates how much money you lose when certain customers leave you.
Formula:

For instance, you started the month of March with $100k revenue and by the end of March, you lose 5 customers. The total revenue that those customers use to bring in was $6k. Then your revenue churn rate would be 6% for March.
SaaS customer experience and satisfaction metrics
CX and customer satisfaction are of utmost importance to SaaS business. Fortunately, through improving digital experiences alone, you can improve both.
However, it’s essential to know what customers feel about your brand. The following SaaS metrics help you with just that.
13. NPS
Net Promoter Score (NPS) is an industry-standard scoring system that provides a customer satisfaction index by asking customers, “How likely is it that you would recommend this company to a friend or colleague?” and allowing them to reply on a scale from 0 to 10. Based on the score, customers are categorized as follows:
- 0-6 score: Detractors
- 7 or 8 scores: Passives
- 9 or 10 scores: Promoters

Why is NPS important?
NPS provides an insight into the customer perception of the brand. Since it asks customers just one question, you are more likely to get replies. It is often more detailed than the five-point rating system that simply averages the data. Using open-ended questions, you can get more information on customer satisfaction.
14. Number of support tickets created
This metric shows you the number of times you receive a complaint, a question, or feedback from your customers. The creation of support tickets implies that the customer is stuck with a problem and requires the company support staff to intervene and help.
For example, a user can create a support ticket if they cannot log in to their account or if a payment fails.
Why is this metric important?
Bugs, glitches, and outages are inevitable in SaaS. The number of support tickets tells you about the performance of your service. It can help you diagnose and fix issues proactively, ensure that newly rolled out features are working smoothly, create better self-service documentation, and retain customers.
How to reduce the number of support tickets
“A lot of times support issues go unnoticed, and they keep occurring again and again. To prevent this, all support tickets must be reported and assigned to appropriate teams.”
Robin Agrawal, Lead – Product, Ajio
Below are steps that you can take to reduce the number of tickets:
- Ensure all issues are reported. Many times, it happens that users get a quick fix without reporting the issue. Such practices must not be encouraged.
- Categorize the tickets and label the root cause of each ticket.
- Prioritize and fix the root cause. Prioritization can be done based on the impact, frequency, or both.
- Once the root cause is fixed, monitor they don’t happen again.
- You can use tools like Jira or Freshdesk depending on internal or external tickets.
15. Average first response time
Average First Response Time (AFRT) is the average time needed for your customer support staff to respond to a newly opened support ticket.
It is also an important call center KPI, as brands sometimes outsource support to call centers.
Formula:

Why is it important to track first response time?
Average First Response Time is an indicator of customer satisfaction. The lower the value, the better. It shows how quickly your support staff gets in touch with the customer once they report an issue.
How to reduce the first response time
Distributing inquiries instantly and notifying sales reps or agents about it can help reduce the first response time.
Businesses use call center CRM or automated lead distribution software to route inquiries to respective agents.
16. Average resolution time
This SaaS metric is the average time needed for your customer support staff to close a support ticket.
Formula:

Why do you need to track average resolution time?
Average Resolution Time determines customer satisfaction and retention. The lower the resolution time, the better. Once an issue is resolved, the customer is more likely to trust the support staff and stay with the brand.
How to reduce the average resolution time
One proven way to reduce the average resolution time is through sales enablement. When an issue arises, people first contact their account managers. If sales representatives are equipped with resources to help their clients resolve the matter instantly, nothing like it.
Sometimes, issues are not resolved because the users don’t know how to raise a support ticket properly. A solution to this is proper customer onboarding. They should have access to support documents and FAQs and should be able to reach out to you through phone, chat, and email.
Another reason for poor resolution time is—the ticket isn’t assigned to the right agent or representative. Aligning your teams and setting up a system to route tickets automatically to the right agent could help.
17. Number of active users
The number of active users is the number of users that are paying to use your service. This excludes people who are on free plans, free trials of the service, or have inactive accounts. Active users are the ones who are responsible for generating revenue.
Why is it important to measure number of active users?
Separating customers into paying and non-paying or inactive users helps brands understand which customers contribute to their profit or revenue. Even though the total user base may grow quickly, the number of paying users may still have sluggish growth. The number of active users helps understand how a business is trending and what sort of a freemium pricing model you should provide.
18. Stickiness ratio
The stickiness ratio determines how much customers access your software service every day.
Formula:

For example, if you have a stickiness ratio of 50%, it means your customers return to use your software every 15 days.
The stickiness ratio determines the number of active users and usually is a good indicator of the health of the service. If a service performs as expected, users will use the service more and stay with the company. The stickiness ratio also indirectly indicates the retention rate.
In conclusion
There’s a saying—you can’t improve what you can’t measure.
The above SaaS metrics help you track your business performance and take measures to improve them.
There’s one more all-purpose tool I would like to recommend that takes care of all your customer-facing operations. That’s CRM software.
LeadSquared is a purpose-built CRM software for businesses with high-velocity sales. It comes with lead, sales, opportunity management, and marketing automation features. Book a demo to know more about how LeadSquared can help your SaaS business flourish.


