


In the fast-paced world of the automotive industry, thriving is not just about great ideas and great vehicles. The real edge is in operational efficiency. This is where automotive key performance indicators, or automotive KPIs, come in.
These operational KPIs are not just numbers; they’re the vital signs of a company’s operational health, a snapshot of how all the processes and functions are working.
In this blog, we’ll dive into the world of operational KPIs for the automotive sector. We’ll look at the types, how they’re measured, and their impact on the company. We’ll also cover how these metrics can transform operational data into action plans, so you can get a competitive edge and long-term success!
Thanks to Abhinav Wuyyuru for sharing his insights.
Let’s dive in!
What is an Operational KPI?
If you want to know how well and efficiently your organization is performing in different areas of your operations, you’ll turn to measurable values called operational key performance indicators – or operational KPIs. These KPIs are about daily tasks and procedures. They give you real-time information – so you can spot problems, monitor progress, and decide how best to optimize operations in your business.
You get a quick view of how certain areas of your business, such as customer service or production lines, are running. You can identify inefficiencies, speed up processes, and make changes quickly so your operations stay aligned to your business objectives.
Why Operational KPIs Matter in the Automotive Industry
India’s automotive industry is expected to grow to USD 214.7 billion by 2032. In the automotive sector, operational KPIs are critical measures that assess the effectiveness of several processes related to business operations. They throw light on supply chain management, manufacturing, sales metrics, and overall production performance. To increase output, reduce costs, and maximize efficiency; these indicators are key.

Automotive companies can find opportunities to streamline processes and stay ahead in a fast-changing market, by monitoring these KPIs regularly. KPIs in the automotive sector – from measuring machine effectiveness to tracking deliveries on time, controlling costs, and increasing worker productivity – are the key to automotive operations success.
Quality control, sustainability, and supplier performance KPIs can keep supply chains stable and products high quality. If you’re in this industry, you can use operational KPIs to optimize workflows, use and share data to make decisions, and ultimately guide your business to excellence in this fiercely competitive industry.
KPIs for Automotive Manufacturers vs Dealerships
Operational KPIs in the automotive industry can be varied as they operate at different stages of the vehicle lifecycle and have different priorities. Automotive manufacturers and dealerships have different operational KPIs as they play different roles in the automotive industry. Dealerships want to improve customer experience and increase sales, while manufacturers want to simplify production and reduce costs.
The operational indicators that measure vehicle production effectiveness are the focus for manufacturers. Production line efficiency, supplier lead time, and cost per unit produced are common examples of KPIs. For dealerships, inventory turnover, customer satisfaction scores, and service department revenue are key factors.
Operational KPIs for Automotive Manufacturers
Operational KPIs are key to maximize production effectiveness and ensure high-quality output. When taken together, these KPIs help manufacturers to reduce costs, maximize efficiency, and minimize downtime – all while maintaining product quality.

Production efficiency
Units produced per hour
This KPI counts the number of vehicles produced in an hour and is key to measuring the production line’s overall performance. A higher number of vehicle units produced per hour is a sign of an efficient production process that maximizes output and meets market demand.
By monitoring this indicator, producers can see problems and opportunities for improvement and ensure output meets sales and operational targets.
Production line efficiency
By calculating the difference between actual production output and maximum output possible in perfect conditions, this KPI measures the production line’s overall performance.

The elements are broken out as follows:
- Actual Output: The quantity of units generated in a given amount of time.
- Maximum Possible Output: The most units that might possibly be produced, if the production line ran at full capacity and without any hiccups or inefficiencies.
Good workforce utilization, streamlined procedures, and well-maintained machinery are signs of high production line efficiency. It is essential for avoiding downtime and operational disturbances while maintaining competitive production speeds.
Defect rates
During production the percentage of vehicles that don’t meet quality standards is measured by defect rates. High quality output and reducing rework costs rely on this KPI.
Lower defect rates mean good production processes and quality control systems which help businesses avoid costly recalls and customer satisfaction.
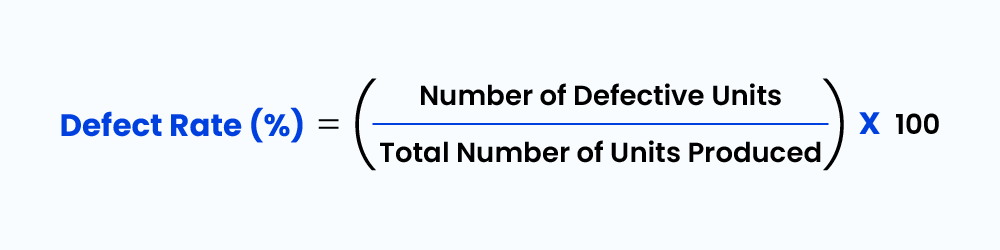
This is how you apply the formula:
- Number of Defective Units: The total number of vehicles that have been found to be flawed or lacking in quality requirements.
- Total number of Units Produced: The total number of goods produced in the same time frame.
Supply chain management
Inventory turnover
This KPI calculates the frequency of inventory sales and replacements over a specified time frame. A high inventory turnover rate is a sign of effective use of parts and raw materials, which lowers holding costs and reduces the chance of obsolete inventories. Maintaining production flow and making sure that resources are available when needed depend on effective inventory turnover.

The elements are broken out as follows:
- Cost of Vehicles Sold: The total amount of money spent on vehicles that are sold in a specific time frame.
- Average Inventory: The average value of the finished vehicle inventory for the same time frame.
Supply lead times
Supplier lead times are how long it takes for suppliers to deliver materials and parts to the manufacturing facility or factory. Shorter lead times mean less production downtime and a smoother production.
Keeping production schedules and preventing disruptions relies on good control of this KPI.
Parts availability
This KPI assesses how ready and available the necessary materials and parts are for production. A high availability of parts guarantees that production processes don’t stall due to shortages.

This is how you apply the formula:
- Number of Parts Available: The total number of parts that are in stock and ready to be purchased or used.
- Total Number of Parts Needed: The overall number of parts needed over a certain time period, which may be determined by production schedules, customer orders, or repair requirements.
Automotive CRM systems like LeadSquared improve partner and inventory management by giving real-time visibility into parts availability and expediting supplier communications.
Quality control
Warranty claims
Warranty claims measure the number of vehicles that experience problems during the warranty period. Fewer claims mean better quality control.
By monitoring this KPI, manufacturers can see trends and put measures in place to increase vehicle reliability.
Recall rates
Did you know, quality issues can cost a manufacturer up to 20% of their revenue?
This KPI measures the frequency of vehicle recalls for defects or safety issues. Lower recall rates mean stricter testing protocols and better quality control systems.
Controlling recall rates is key to your customer’s safety and your brand’s reputation.

This is how you apply the formula:
No.of Units Recalled: The aggregate number of units that were recalled because of flaws, security concerns, or other reasons.
Total No.of Units Sold: The total quantity of units delivered or sold within the same time frame.
Customer satisfaction with vehicle quality
This KPI measures how satisfied customers are with the vehicles they buy. High customer satisfaction ratings signify that the vehicles fulfill or beyond the expectations of the customers.
LeadSquared’s customer feedback tools can highlight areas for quality improvement and provide insights. Plus, LeadSquared is a comprehensive CRM that helps you with your customer engagement efforts too!
Cost management
Cost per unit produced
The average cost of manufacturing every vehicle, including labor, materials, and overhead, is determined by this KPI.
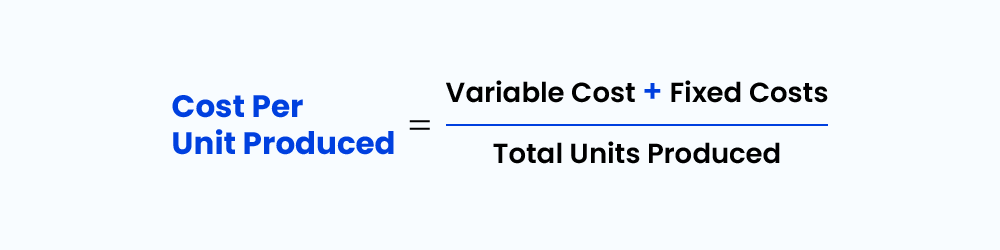
To keep up profitability, manufacturers can find ways to cut costs and improve production procedures by keeping an eye on this indicator.
Production overheads
To keep up profitability, manufacturers might find ways to cut costs and improve production procedures by keeping an eye on this indicator.
Indirect manufacturing costs including electricity, maintenance, and facility expenses are included in production overheads. To maintain overall cost control and the profitability of manufacturing, these expenses must be kept in check.
Material costs
Material costs keep tabs on the costs related to the raw materials used in the manufacturing of vehicles. Manufacturers can reduce manufacturing costs and increase profit margins by managing material costs well.
As a manufacturer, you can improve their cost effectiveness and competitive competitiveness by optimizing material utilization and procurement.

Here,
- Quantity of Material: The total of material used or bought, expressed in litres, kilograms, or other units.
- Unit Cost of Material: The material’s cost per unit.
By routinely tracking these important operational KPIs, you can save expenses, enhance overall processes, and increase production efficiency.
“We’ve seen many automotive manufacturers implement LeadSquared for their dealerships. This allows manufacturers to streamline their processes while also maintaining a degree of control over their dealerships.”
– Abhinav Wuyyuru, Vertical Marketing Specialist, Enterprise Marketing, LeadSquared
Now, if you’re associated with an automotive dealership, here are the KPIs you should focus on:
Operational KPIs for Automotive Dealers
Inventory management

Days on lot
The average amount of time a vehicle remains at a dealership before being sold is tracked by this KPI. Reduced days on lot show that the dealer is effectively managing their inventory and that vehicles are selling swiftly.
This indicator guarantees that the dealership keeps a fresh and attractive inventory on hand while minimizing holding expenses related to unsold vehicles, which improves cash flow and sales results.
Inventory turnover
Over a given time period, this KPI measures how frequently the dealership sells out and restocks its inventory. A high turnover rate of inventory means that the dealer is successfully matching supply to demand, which lowers excess inventory and related carrying costs.
By optimizing both space and capital, efficient inventory turnover guarantees that the dealership is flexible and responsive to client preferences.

Where:
- Cost of Vehicles Sold: The entire cost related to the vehicles that were sold at the point in time. This covers the cost of manufacturing or acquisition of the sold vehicles.
- Average Inventory of Vehicles: The average number of vehicles kept in stock over a certain time frame.
Stock-to-sales ratio
This KPI examines the relationship between the volume of sales achieved and the amount of inventory held. To prevent stockouts and overstock, dealerships can better balance their inventory levels by maintaining an ideal stock-to-sales ratio.
Better inventory control and financial performance are supported by the dealership’s ability to meet client demand without having an excessive surplus thanks to effective management of this ratio.
Customer satisfaction
Customer satisfaction scores
This KPI calculates how happy customers are with their dealership experience. Positive service experiences are reflected in high customer satisfaction (CSAT) numbers and are essential for building repeat business and customer loyalty.
Profits can grow by 25% to 95% even with a 5% increase in client retention. With high customer satisfaction scores, you know that customers have enough faith in you to come back when they have more demands or further requirements – leading to an increase in the rate of repeat business.
As a dealership, you can identify areas for improvement and areas of strength by keeping an eye on these scores – which improves client retention and service quality. You can conduct surveys to find information about this KPI.

Here,
- Number of Satisfied Customers: Total number of respondents who gave a score of 4 or 5 out of 5, 5 being the highest.
- Total Number of Survey Responses: Total number of responses that were to the survey.
Net Promoter Score (NPS)
It measures customers’ probability of telling others about the dealership. Strong client satisfaction and loyalty are indicated by a high NPS.
A higher NPS means more word-of-mouth! Here’s what a man who needs no introduction in the world of business says about that:
“If you build a great experience, customers tell each other about that. Word of mouth is very powerful.”
– Jeff Bezos
The Net Promoter Score KPI is useful for figuring out what influences a good or bad customer experience and for gauging general customer attitude. Increasing recommendations and building a better reputation in the market can result from growing NPS.
Post-sale follow-up ratings
This KPI assesses customer feedback regarding the after-sale support received from a vehicle purchase. Good follow-up scores imply that the dealership continues to effectively contact customers long after the sale.
Maintaining this KPI fosters long-term connections and continuous client satisfaction, which promotes referrals and repeat business.
“For automotive dealerships, some important factors here are how many leads come from various sources – such as inquiry calls – and get converted to test drives. And how many test drives are converted to purchases. New opportunities are created based on the purchase intent of the customers.”
– Abhinav Wuyyuru, Vertical Marketing Specialist, Enterprise Marketing, LeadSquared
Service department performance
Service department revenue
This KPI reflects the service department’s operational effectiveness and financial performance. This income stream includes earnings from sales of parts and other services provided to customers as well as from repairs and maintenance of vehicles.
High revenue from the service department is a sign of successful marketing and operational plans, as well as excellent customer satisfaction and loyalty. On the other hand, dwindling revenue could indicate possible problems including a drop in clientele, inefficiencies in the provision of services, or a requirement for increased marketing.
Service Department Revenue = Revenue from Repairs + Revenue from Maintenance + Revenue from Parts Sales + Revenue from Additional Services
Average repair order value
The average revenue generated per service transaction is tracked by this KPI. A greater average repair order value is a sign of good service offering management and successful upselling.
Dealerships can increase profitability in the service department and optimize income from each service visit by using this statistic.

Here,
- Total Revenue from Repair Orders: The total amount of revenue received from repair orders over a given time frame.
- Total Number of Repair Orders: The total number of repair orders handled in the same time frame.
Service appointment wait times
The average amount of time that clients must wait for a service appointment is measured by this KPI. Reduced wait times are a result of effective operational and schedule management, which raises customer satisfaction.
Dealerships can increase the effectiveness of their service departments and draw in more customers by shortening appointment wait times, which will increase service revenue.
LeadSquared offers tools for managing after-sales services. You can improve scheduling, customer feedback collection, and service performance tracking. Overall client happiness and the performance of the service department are enhanced by these capabilities!

Marketing effectiveness
Lead generation rates
The number of leads generated through marketing initiatives is tracked by this KPI. Elevated lead generation rates signify that marketing tactics are successfully drawing in prospective clients.
Dealerships can assess the effectiveness of their marketing campaigns and improve lead acquisition tactics by monitoring this measure.
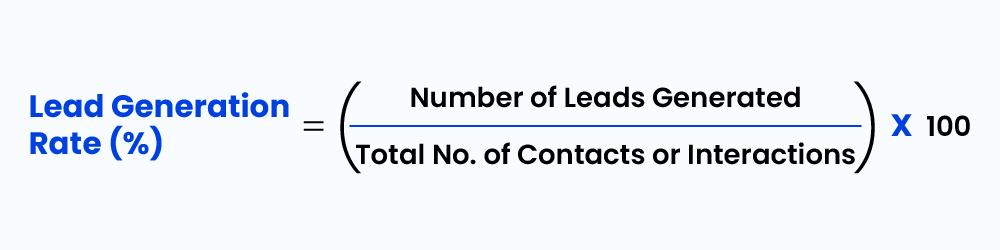
Where:
- Number of Leads Generated: The total number of potential customer leads throughout a given time frame.
- Total Number of Contacts or Interactions: The total number of contacts or interactions as a result of marketing initiatives, campaigns, or sales outreach.
Cost per lead
The average cost of obtaining a single lead is determined by this KPI. Better campaign performance and more effective use of marketing resources are reflected in lower costs per lead. Dealerships can better manage their marketing expenditures and spend their money for higher returns by keeping an eye on this indicator.
You should know, that LeadSquared CRM has the perfect lead management system for you! It helps in capturing, handling, and nurturing your leads. Your sales team can thus focus on hitting their quotas instead of spending a lot of time on labor-intensive, repetitive manual tasks.

Return on Advertising Spend (ROAS)
This measures how much money is made for every rupee or dollar spent on advertising. A high ROAS means marketing is paying off and driving sales.
With this KPI, dealerships can measure the success of their ads and ensure their marketing is profitable.
Automotive dealerships must track these operational KPIs to manage inventory, customer satisfaction, service department performance and marketing effectiveness.

Elements:
- Revenue Generated from Advertising: Total revenue attributable to the advertising campaign. This includes conversions or sales that come straight from the advertising investment.
- Cost of Advertising: The entire amount allotted to the campaign for advertising.
Do It With LeadSquared
Whether you are part of a manufacturing facility or a dealership, you can use LeadSquared’s Automotive CRM – a comprehensive platform with powerful tools for automating processes and gaining actionable insights. You can easily reduce your sales turnaround time (TAT) with LeadSquared.
What’s more? LeadSquared is a cost-effective solution for your automotive business, and prides itself on providing you with reliable and dedicated customer support. It has been trusted by some leading automotive businesses in the world – Bajaj, Hero, Ola Electric, and Bolt.earth to name a few!
Make data-driven decisions, increase operational effectiveness, and spur business expansion – with LeadSquared. Schedule a demo now!


